At Extended DISC we often are asked about how to identify and explain profiles. Specifically, a person’s hardwired behavioral style, their perceived need to adjust behavior; and also, what happens when DISC profiles are invalid and cannot be generated?
Not all DISC Assessments are the same
The DISC theory belongs in the public domain; no one owns DISC. There are different assessments based on the DISC theory, but they do not necessarily measure the same thing. There are DISC assessments which focus on the respondent’s belief of how they need to be in their current role versus hardwired style. Some DISC tools also do not have test-retest validity so it’s hard to trust the results.
Extended DISC measures individuals hard-wired behavioral style; who we really are or our most comfortable ways of doing things. It is a more accurate identification of a person, which makes it a more effective starting point for one’s development.
Extended DISC vs. DISC
The biggest difference between Extended DISC and DISC is that Extended DISC measures one’s hardwired style. Ultimately, the tool is trying to help people understand how to modify their behavior effectively. In order to modify behaviors effectively, we first need to increase our self-awareness. Our natural behavioral style identifies the behaviors that are most comfortable to use, take the least amount of energy, and predicts how we tend to do things.
On the other hand, our perceived need to adjust or conscious behavior identifies how we feel we need to be in our current environment. Conscious behaviors are often changing, unlike our stable hardwired natural style. Hardwired DISC-style is a more accurate starting point for making adjustments and in our development.
Extended DISC Natural Style Profile
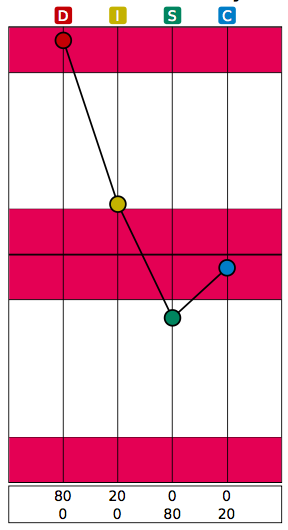
The DISC profile graph is a visual representation of a person’s DISC style based on the results of the Extended DISC questionnaire. A person’s natural DISC style is measured as a relationship of all 4 DISC styles. Everyone has all 4 DISC styles, but there are those which are more comfortable and those which require energy. There is no better or worse style; simply different.
The simplest interpretation is to look at the intersection points on the 4 axes and determine the highest point. This is the person’s most comfortable style. In the example above, D-style is the most comfortable style. The lowest intersection point below the middle line represents a person’s least comfortable style. S-style which intersects at the lowest point below the middle line is the persons least comfortable DISC style.
Training may be needed for further interpretation.
Extended DISC Perceived Need to Adjust Profile
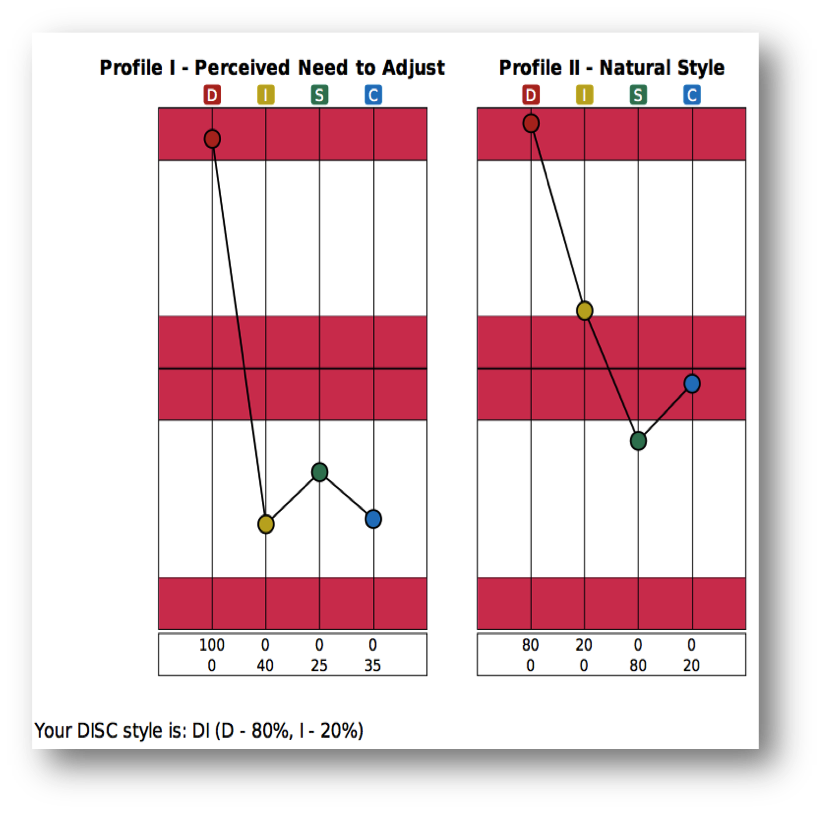
The Perceived Need to Adjust (Profile I) identifies how people want to make changes to their Natural Style (Profile II) in order to be more successful in their current environment. Unlike the stable hardwired Natural Style, the Perceived Need to Adjust is a transient profile; it is constantly changing. It is a snapshot of how the person feels they need to be at the time they took the assessment.
In the example above, Stephen Sampleship’s Natural Style (Profile II) is 80% D and 20% I. When comparing Profile I to Profile II Stephen’s I-Style, which was part of his natural style, drops below the middle line. It shows he wants to suppress his I-style and focus solely on his D-style.
Training may be needed for further interpretation.
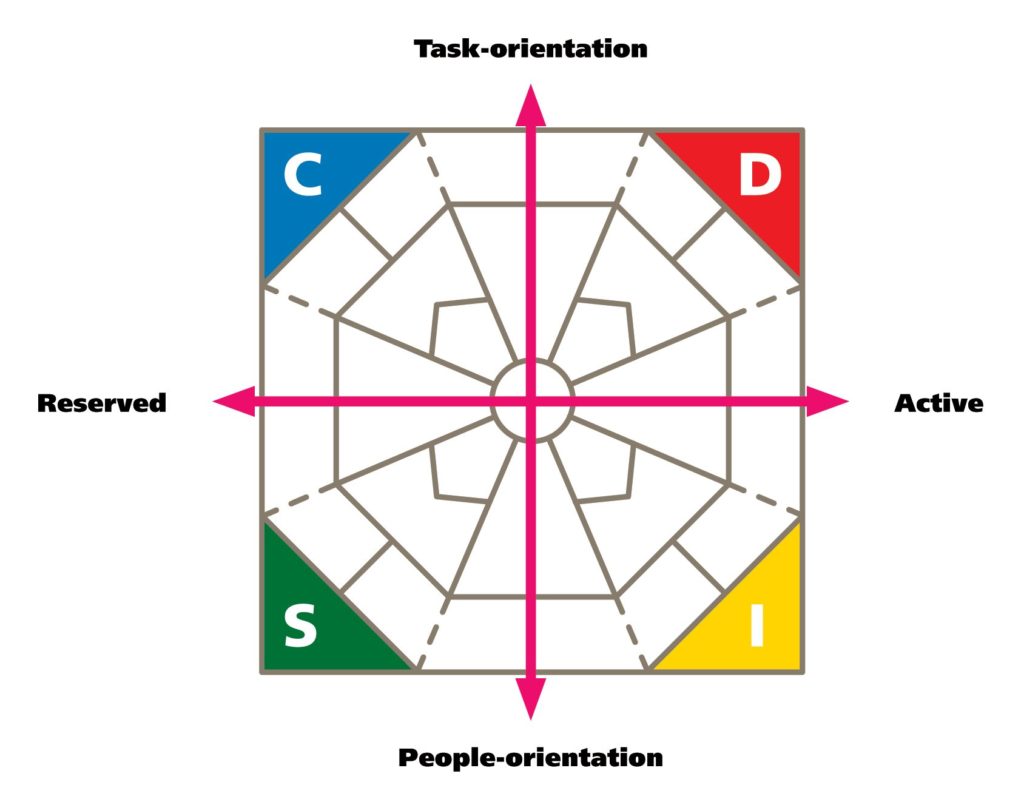
The Extended DISC® Diamond and Style Chart
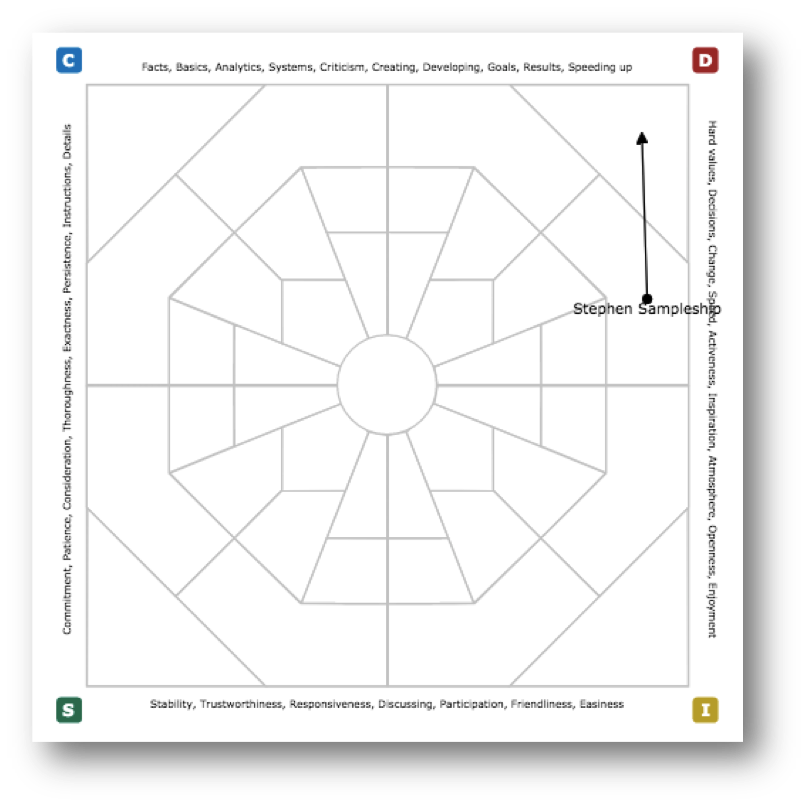
There are additional ways to view DISC profiles including the Extended DISC Diamond and Style Charts. The natural style is simply identified by the dot or beginning point of the arrow. The arrow, specifically the tip, represents the person’s perceived need to adjust. In the sample above, Stephen Sampleship’s dot is located in the D quadrant. His most comfortable style is D. He perceives a need to adjust to be 100% D.
The Diamond is also very useful in identifying DISC styles for groups of people. Multiple people can be plotted on the Diamond.
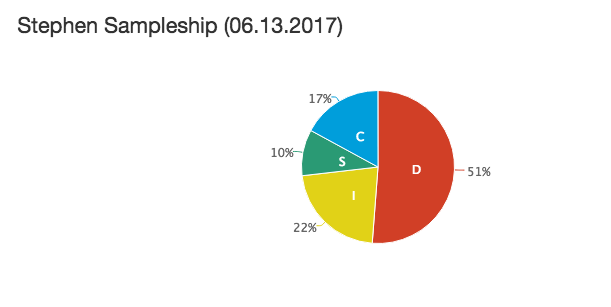
The DISC Style charts are yet another way to identify DISC profiles. There are times when less is more. For example, the Style Charts can be used when presenting a high level or brief overview of DISC to clients or employees and the detailed information of the Profiles and Diamond might be too much data. Pie charts are familiar to everyone and easy to interpret. They clearly identify which DISC styles are most comfortable.
In the example above, Stephen is most comfortable with D-style, followed by I-style and C-style. His least comfortable style is S-style since it is the least represented on the pie chart.
The DISC style can also be written out in the report, without any charts or graphs to further simplify. For example, the statement for Stephen Sampleship states, “Your DSC Style is: DI (D – 80%, I – 20%)“.
Trust the results
One of the most important questions needing to be asked is, “Can the results be trusted?” In some DISC assessments, the random selection of responses still generate a DISC profile. However, those types of results are misleading and could cause inaccurate decisions based on those results. Extended DISC has built in validity checks which gives one confidence in the results.
The Extended DISC Profiles, Diamonds, and Style Charts are various ways to provide practical and reliable options for presenting and interpreting DISC profiles.