
Understanding DISC profiles can be challenging without DISC training. However, we can present different ways to explain them to make sure our clients have a clear understanding of their DISC profiles.
Understanding DISC profiles gives us information about our natural behavioral style. First and foremost, we need to recognize that we have all four DISC styles in us. What the Extended DISC assessments simply show are which behavioral styles are natural and comfortable to us and which styles take energy and focus. The DISC report does not categorize people into better or worse, nor measure attitudes, skills or abilities.
Understanding DISC Profiles

When looking at DISC profiles, remember that the graph line represents a person's DISC style (see graph representation below). The graph line intersects at all four of the DISC axes. You want to see where the line intersects in the top half of the graph. Anywhere it intersects one of those 4 D, I, S, and C axes in the top half of the graph is your natural DISC profile. Anywhere the line intersects in the bottom half of the graph are those styles which do not come naturally to you. Your DISC profile is not about your attitudes, skills, or ability. Your DISC profile shows the behaviors which come naturally and comfortably and the behaviors that you need to focus on. Another way is to think in terms of energy. Which behaviors don't require energy and which behaviors do require energy?
Above and below the surface: a different way of understanding DISC profiles
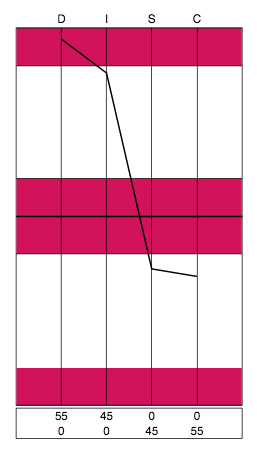 Extended DISC Natural Style Graph
Another way to understand your DISC profile is to visualize the surface of a lake. Anything above the surface of the water, like ducks, rocks, and plants are clearly visible to us. Anything below the surface of the water, like fishes, are not clearly visible to us, but we know they're there. So, unless the fish uses energy to jump out of the water and above the surface then we don't see it.
The same idea applies to DISC profiles. See the example DISC profile graph above. The two DISC styles that are above the middle line or above the surface are the DISC profile behaviors that will be clearly observed in this person by others. For this example, we see the D profile and the I profile are the 2 styles above the middle line and therefore, we'd typically see D-style and I-style behaviors in this person. The two C and S styles, from the above example, that are below the line are the DISC profile behaviors that are not likely to be observed in this person.
Understanding DISC profiles is a step to improving communication
Our DISC reports are behavioral assessments. Behaviors are something we can adjust and modify in order to improve communication and interactions. If you know your DISC profile then you can begin to understand how you prefer to do things. Your DISC profile also gives insight into how you show up under pressure. When we feel stressed or pressured we don't have the same focus and energy to adjust. We can become more of who we really are.
Learning the surface water analogy can help you better explain our DISC profile. In addition, now that you have a better understanding of DISC profiles, you also have a starting point in which to make effective and appropriate behavior modifications.